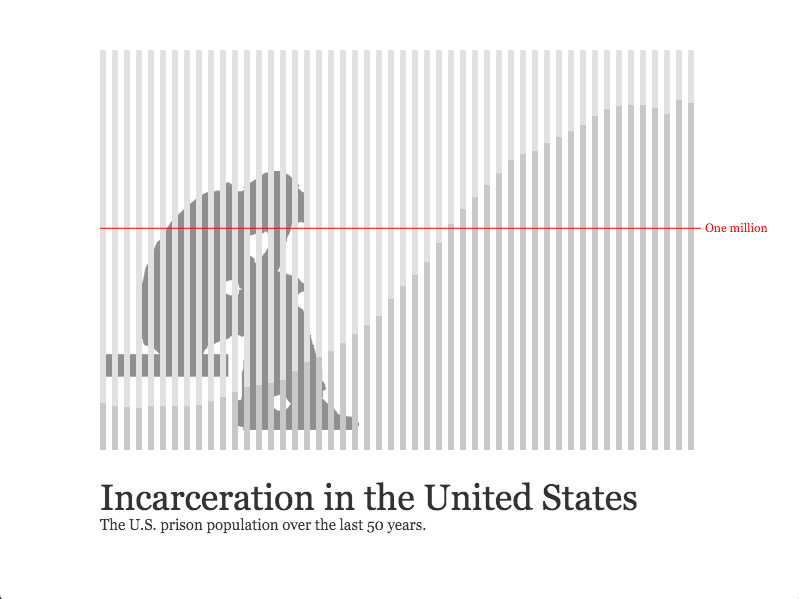
The following dataset represents the prison population in the USA over the past 50 years. Use an array and a for loop to visualize this information any way you'd like (e.g. bar graph, multiple lines, circle sizes, etc...). These are large numbers, so you'll most likely have to alter the scale using a division operator (/). Make sure all numbers represented visually in your sketch on screen.
210895,199654,194896,187914,196007,196429,198061,196092,204211,218466,240593,262833,285456,294396,301470,315974,353673,395516,419346,443398,480568,522084,560812,603732,680907,739980,789610,846277,932074,1016691,1085022,1137722,1194581,1245402,1304074,1331278,1345217,1380516,1408361,1433728,1462866,1504598,1532851,1547742,1553574,1552669,1538847,1511480,1576950,1561525
Below are the five tallest buildings in the world. Create an array of objects using these numbers and visualize all the information (i.e. the building name and height). Include a rect to represent each tower, making its height relative to its size in feet. Make sure the bottom of all the rects are aligned bottom (perhaps use rectMode(CORNERS)). Include labels for each, including name and location.
Burj Khalifa, Dubai, 2717 ft
Shanghai Tower, Shanghai, 2073 ft
Abraj Al-Bait, Mecca, 1971 ft
Ping An Centre, Shenzhen, 1969 ft
Lotte World Tower, South Korea, 1823 ft
For this project, you will be creating a data visualization. You may look at this example I created in p5.js using the dataset that we used for Exercise 5.0. I also used an image (not necessary, but see how to load imagery here). To complete this assignment, please do the following:
Take a look at the following for inspiration:
Flight Patterns [1] (Aaron Koblin)
Some artists working with data visualization: Aaron Kolbin, Martin Wattenberg, Nick Feltron, Stamen Design.
To hand in your work get the URL from the editor and link to it from your index.html page. To receive credit, it must be uploaded by class on the date specified. Label it clearly. Here is help if you need it.
Projects will be graded on both creativity and implementation.